
Here is a simple example of using Component-Watch. The simplest way to demonstrate its abilities is to use it to uncover the structure and components of a simple java program. So let's analyse the Component-Watch program itself!
Assuming that you've downloaded and installed the program, you will see that, in 10 minutes, starting from scratch, you will be able to discover all the program components and build nice diagrams explaining its structure.
If, in addition, you have installed the examples, you will be able to see how Component-Watch immediately discovers the structure errors that are added in a program.
Note: During this example we will refer by <install_directory> the directory where you actually installed Component-Watch.
If, during this example, you just want to read but not practice and enter all the data, you can open the <install_directory>/examples/self-analyse.xml which contains the project you should have built as end result. You should also be able to open is from the File/Reopen Project/self-analyse menu item.
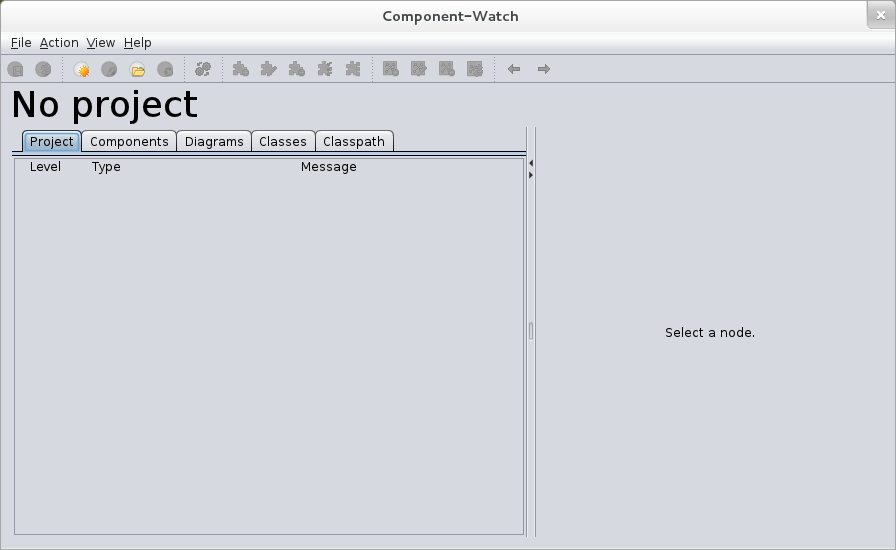
When you start the application the first time, you see the following screen with no project defined:
Note: Take some time, during the first run, to resize windows, dialogs, split panes, table columns to something best fitting your screen size and the displayed content. All those settings will be automatically saved and re-used at next run, so this is only one-time work.
As in any application, don't forget to save your project after key modifications.
Click on the  "new project" toolbar button
In the new project box at the right, fill-in the following fields (and leave the default value for others):
It means that the tool will parse all the classes below the "net.sf" package and analyse their relations. With all the jars to parse are in the "lib" directory below the application installation directory.
With that, you have told the tool where to find the classes to analyse and which classes are relevant for analyse. So let's launch your first analyse...
Press the  "analyse" toolbar button.
What you see then is a lot of red and orange messages in the "Project" tab. The tool is telling you that it found a lot of classes that does not belong to defined components. It's normal because defining components is the next step.
You can also see in the tab "classpath" that the tool found the jars of the application.
Most of the time, the jar packaging of an application reflects the components (e.g. all classes of the log4j component are in a log4j-xxx.jar). So, Component-Watch provides a helper to create components automatically from the detected jars.
Click on the "Components" tab, then click the  "Auto-create components from classpath" toolbar button.
You see a dialog showing all the matching between "jar files", "packages" and components (where, of course, there is no component yet). The default strategy is to create one component per jar file, so simply click the "--> Create" button and the "Ok". You have now created one component per jar file, you can see all you newly created components (and their definition) in the "Components" tab.
Then click again the "analyse" toolbar button and you can see that classes have been assigned to your components. Now, the "Project" tab will show you about 20 orange lines. Those lines are saying that the analysed code referencing some classes that are not owned by any components. If you read the messages (click on any message to see the corresponding class details, or double-click the message to see message details) you can see that all those classes belong to DOM and SAX java API.
Here you have two choices, either you decide that, as those classes are java basic API from rt.jar you will totally ignore them just like you ignore all relations to classes like java.lang.String because it's not relevant for analysis (hence you should update the "Ignored Classes" patterns of the project) or create components for those classes because you think that making theses relations visible help to understand the structure of the analysed application.
Let's create components in this case:
Go to the "Components" tab and press the  "add component" toolbar button.
In the dialog, fill-in:
and press "Ok".
Do it again to add a component for DOM where you fill-in:
and a last time to add a component for the access to the "sun.misc.Service" class.
After that, press once again the "analyse" toolbar button, and you should see neither warning nor error anymore.
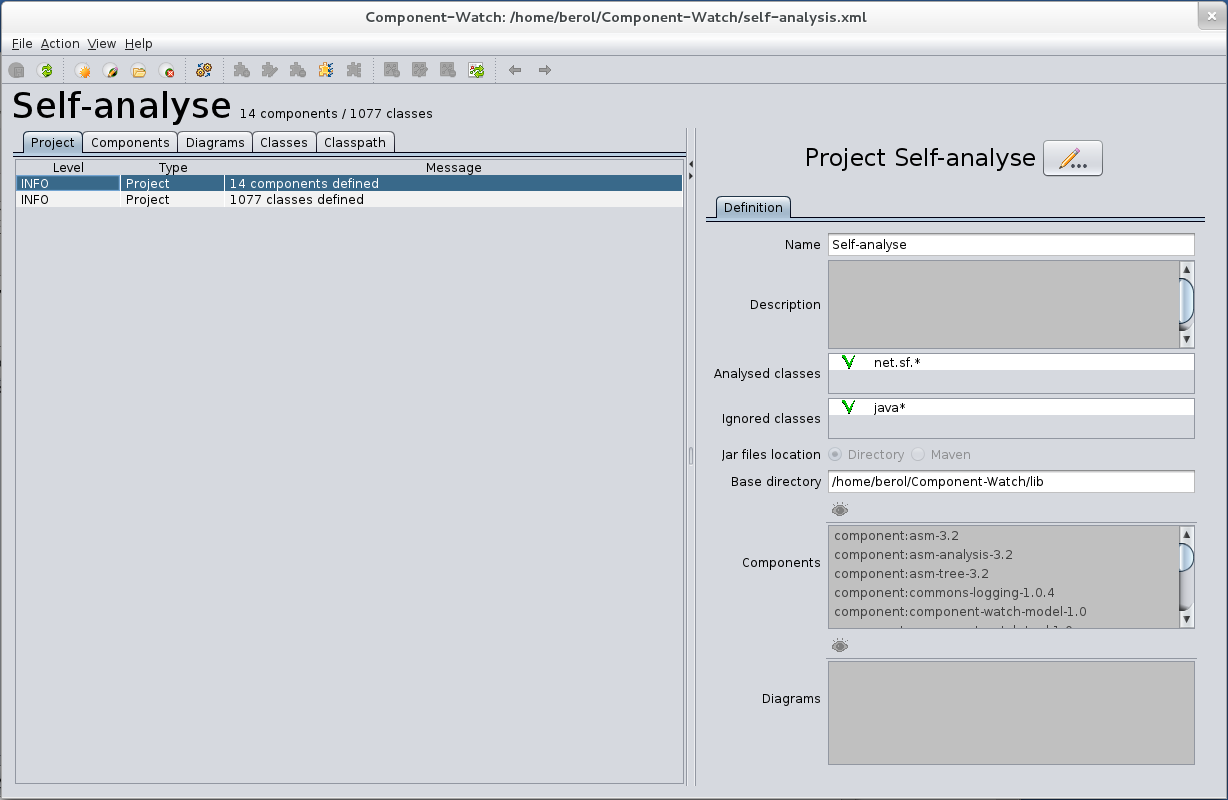
Now that you've a stable project,  save it. A Component-Watch project is saved as a XML file.
At this stage, your project should look like:
In "Component-Watch" you can express the application structure by defining bigger components containing the base components you already defined. One common way is define layers and attribute each component to a layer. In a more abstract way, you partition (in the mathematical sense) your set of base components into bigger components (that you named "layer").
Component-Watch provides a helper dialog to create such partition.
Go to the "Components" tab and press the  "partition component" toolbar button.
You will see an empty partitioning dialog:
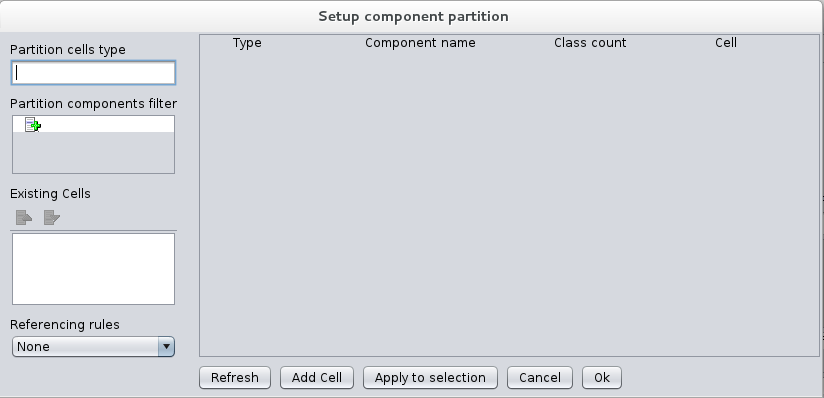
Just input "layer" as "Partition cell type" and press the "Refresh" button
Then with the "Add layer" button add 3 layers named:
After that, apply the layer to the displayed components by selecting a layer and selecting the target components then pressing the "Apply to selection" button.
Apply a layer to each component so that you have the result showed in following screenshot:
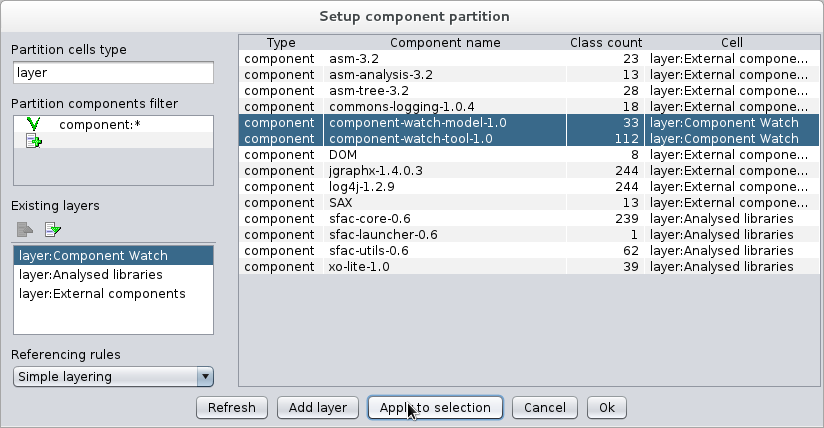
Then press "Ok" and your components are partitioned in 3 layers.
Note: The components added by the partition helper are regular components, you can achieve the same result by adding them with the "add component" button and setting manually the sub components and forbidden references.
As for any component definition, you can inspect and modify the actual content of the added "layer" components by selecting them in the component list of the "Components" tab.
Now that you have all the components you need to express the program structure, to complete the structure definition, you can define rules about the relations of the components.
Here, as we decided to organize our components in layers, we will add a "layering" custom rule. It means: a constraint saying that your program is organized in layers where a class in the "upper" layer can reference any class in layers below, but not the contrary.
For the rules, you naturally go to the "Rules" tab.
There you already see all the "System Rules", it's the rules that are added automatically to report constraints errors at any level in the analysis process. For example, all the red and oranges lines you have seen at the beginning of this example were generated by the "Orphan" system rules. This rule says that all detected classes must belong to a component.
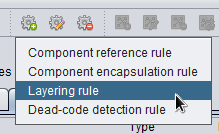
Click the  "add rule" toolbar button and select "layering rule" in the popping menu.
You will see the "Add rule" dialog showing.
In the "Layer type" field type: layer
You will then see all the layers you have defined appearing in the "Layer Names" list.
Ensure that the layers names are correctly ordered (used the arrows to move them if needed) as in the screenshot below.
The "Component-Watch" layer must be on top, and "External components" at the bottom.
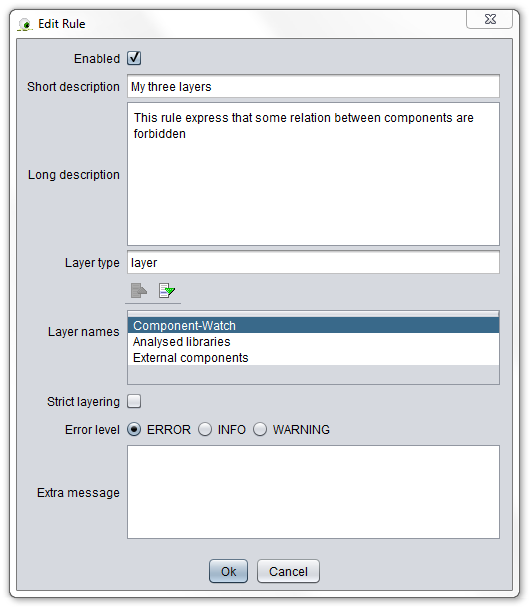
Press "OK" to add the rule.
You have now a project with some structure defined and enforced by a rule.
Launch the "Analyse" again, if everything is setup as described, you should not see any error in project tab.
The diagrams allow you to display the relations between a selected sub-set of components of your project.
To define a diagram:
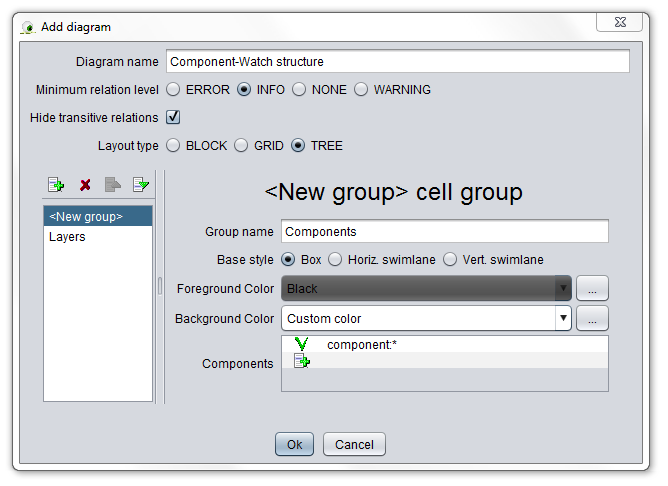
 "New diagram" toolbar button. The diagram form opens in a dialog box:
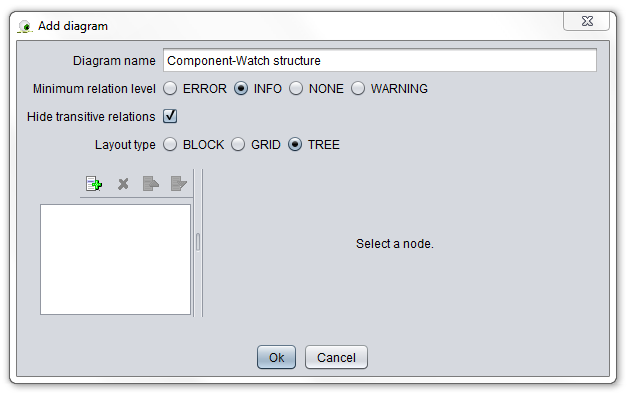
Enter data as following:
Click on the  "Add item" button to add a component group. A components group is simply a selection of components that is represented with a specific style in the diagram.
Note: to be able to edit the newly added group (temporary named "<New group>"), you have to select it in the group list.
Input the following values:
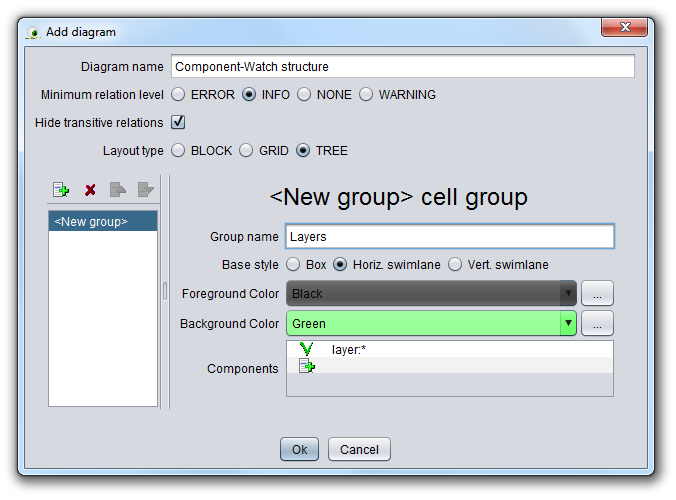
Click again on the "Add item" button to create a new component group, select it in the list then name it "Components", with "Box" as "Base style" and "component:*" pattern selection.
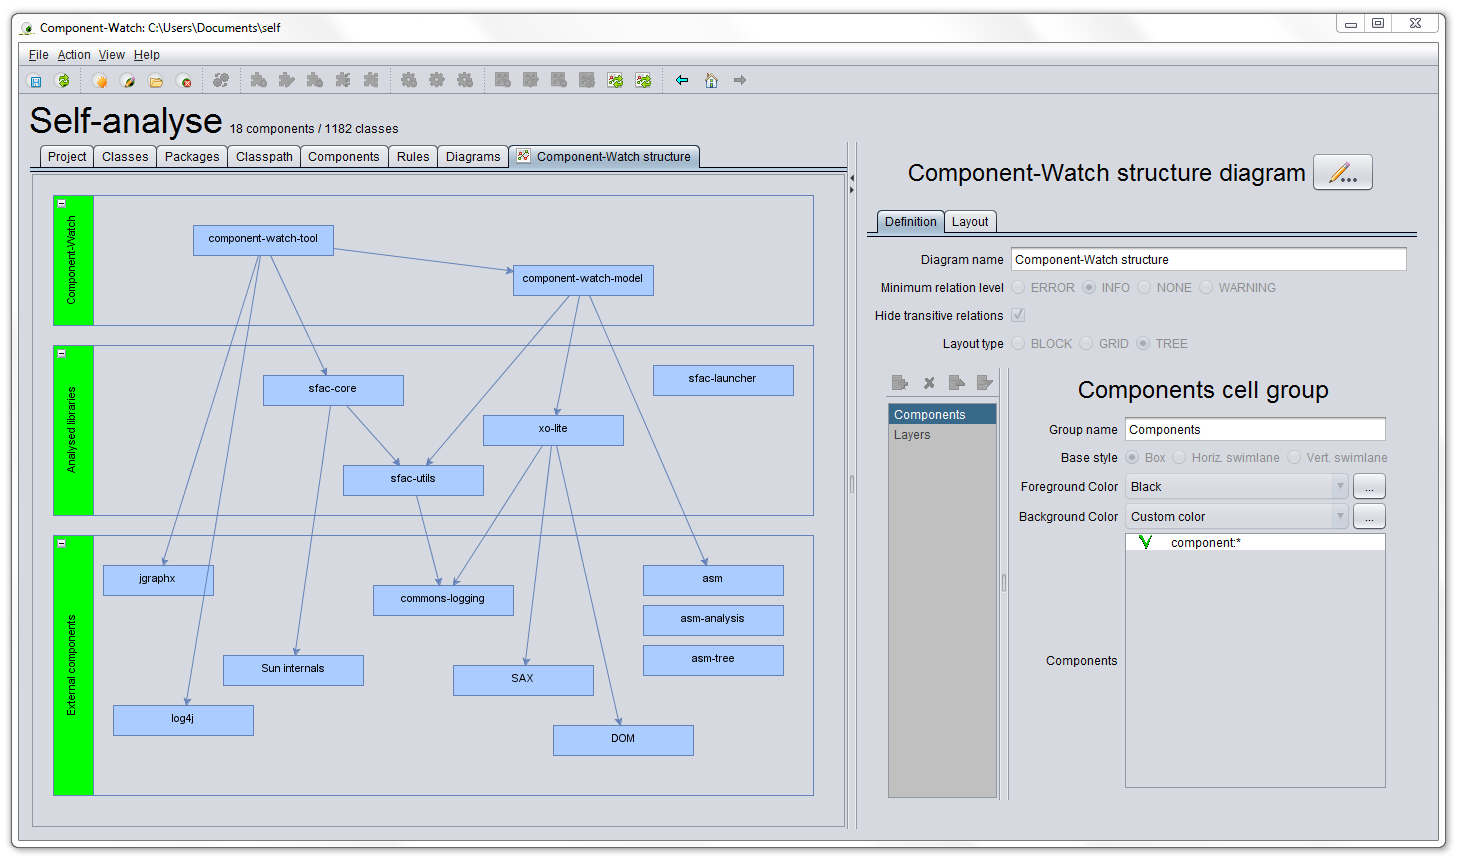
Your diagram definition is done! Press the "analyse" toolbar button and, when the analyse is done, a new tab named "Component-Watch structure" (or whatever name you gave to the diagram) is added.
The tool does a best-effort to layout the diagram automatically, but it cannot do it as nicely as a human (because a lot of meaning is added in the relative position of the elements). So, you have enhance the lay out the diagram components yourself to have it really perfect. But, once it's done, the tool will remember the components position and restore it correctly each time the diagram is re-generated. The result should look like next screenshot:
Note: If, during the manual layout of the diagram, you messed up the links between components, just press  the "Refresh the graphs" button. It will only keep the box and swimlanes size and position and re-generate the links from the analysed components relations.
If you have installed the examples there is an alternate set of jars where some reference errors have been intentionally added (in the <install_directory>/examples/badLib directory) to simulate a developer mistake.
Click on the  "Edit project" toolbar button and, in the project edition dialog box, change the "Base directory" field to <install_directory>/examples/badLib.
Then, launch the analyse again.
As the tool re-evaluates all the class relations, it immediately detects the added relation between the "sfac-core" and "Component-Watch-model" components which is forbidden (because of layer dependency restriction).
You see that the analysis report shows 2 errors: one for the forbidden relation starting from the layer and one for the forbidden relation starting from the culprit component inside this layer. If you click on an error line, the related component is shown at the right and allows you to browse easily to the root cause (in this case the class net.sf.sfac.gui.framework.ApplicationFrame).
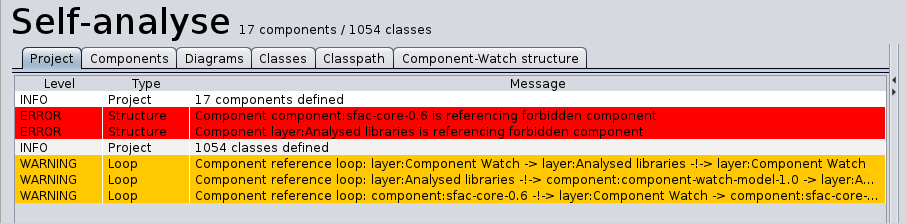
Notice also that the bad reference introduces references loop between components that are also detected by the tool. Those loops have a "Warning" level because they contain a structurally-bad reference. In this case, the problem root is the bad reference (which is reported with an "Error" level) and not the loop itself.
If you go to the "Component-Watch structure" diagram the error spotting is even more obvious as the bad relation is shown in red. If you click on it, the right pane displays the details of the relation where you immediately see all the participating classes.
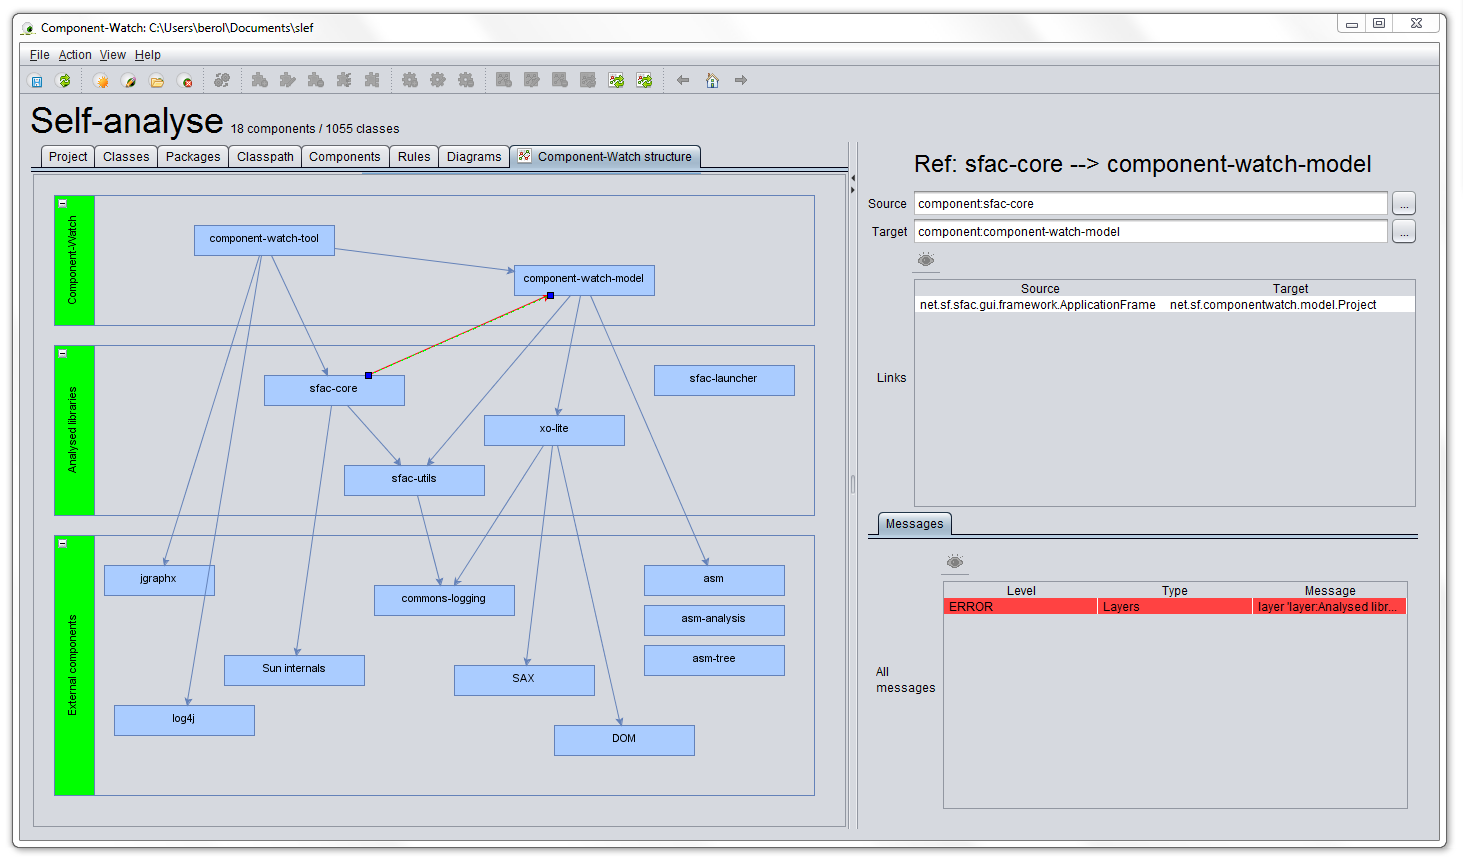
This is where all the power of this tool resides. All the definitions and diagrams you've made are not one-shot static data (like in a document or spreadsheet). The real dependencies between classes are not stored, they are re-evaluated each time in a very efficient way allowing a true, complete and instant view of the application structure.
This 10 minutes example shows you the efficiency and utility of Component-Watch to:
With this tool, component and structural view is not anymore an architect dream decoupled from the developer reality. You are sure that what is described is effective and up-to-date.
This 10 min. tutorial was focused on a quick overview of the tool. You can continue with the fine-tuned example to see improvements you can bring to this first-pass example.
